Comprehensive Guide to Data Flow Diagrams (DFD): Demystifying Information Flow
Navigating the labyrinth of complex systems demands a beacon of clarity, and that’s where Data Flow Diagrams (DFD) come into play. In this comprehensive guide, we will delve into the depths of DFD, offering not just examples but a detailed exploration of its components, rules, advantages, disadvantages, and a step-by-step tutorial.
Understanding Data Flow Diagrams (DFD):
At its essence, a Data Flow Diagram is a visual representation of how data moves within a system. It serves as a dynamic map illustrating the input, output, sources, storage, and destinations of data within a system. The key elements of a DFD are:
- Processes: These are the core activities within the system, ranging from simple tasks like data collection to complex processes such as generating comprehensive reports.
- External Entities: These are the sources or destinations of information that interact with the system, including individuals, organizations, computers, or other systems.
- Data Stores: Repositories where data is held, representing information that is static and not in motion.
- Data Flows: These illustrate the movement of data between external entities, data stores, and processes, mapping the paths data takes within the system.
Symbols Used in DFD:
To bring the elements of a DFD to life, symbols such as those from the Yourdon and Coad system are employed, simplifying the creation and understanding of these diagrams.
Rules and Guidelines for Crafting DFD:
Creating a coherent and intelligible DFD requires adherence to certain rules:
- Process Flows: Each process must have at least one outgoing and one ingoing data flow.
- Data Store Connectivity: Data stores should have at least one incoming and outgoing data flow.
- Entity-Process Link: Entities must be connected to a process by a data flow.
- Avoiding Crossings: Data flows cannot cross with each other.
- External Entity Access: Data stores cannot directly connect to external entities.
Advantages and Disadvantages of DFD:
Understanding the pros and cons of DFD is essential:
Advantages:
- Graphical Simplicity: A visually intuitive technique, easy for stakeholders and users to understand.
- Detailed View: Provides an in-depth view of system components and boundaries.
- Functional Breakdown: Illustrates a functional breakdown of the system, showcasing how different components interact.
- Documentation Value: Serves as a valuable part of system documentation.
Disadvantages:
- Time Consumption: Creating DFD can be time-intensive.
- Timing Information Gap: Lacks information about the timing, sequence, and synchronization of processes.
- Non-Technical User Challenge: Might pose a challenge for non-technical users to comprehend the diagram.
DFD Examples:
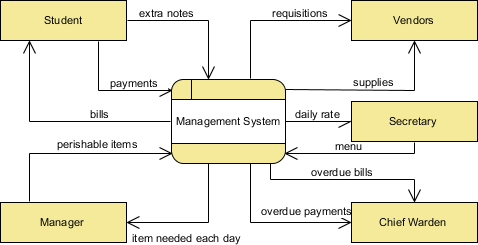
- Context Data Flow Diagram (Level 0): This high-level overview uses a single process to represent the entire system’s functions. An example for a Clothes Ordering System is illustrated below:
 Steps for Creating Context DFD:
- Define the process.
- Create a list of external entities.
- List data flows.
- Draw the diagram.
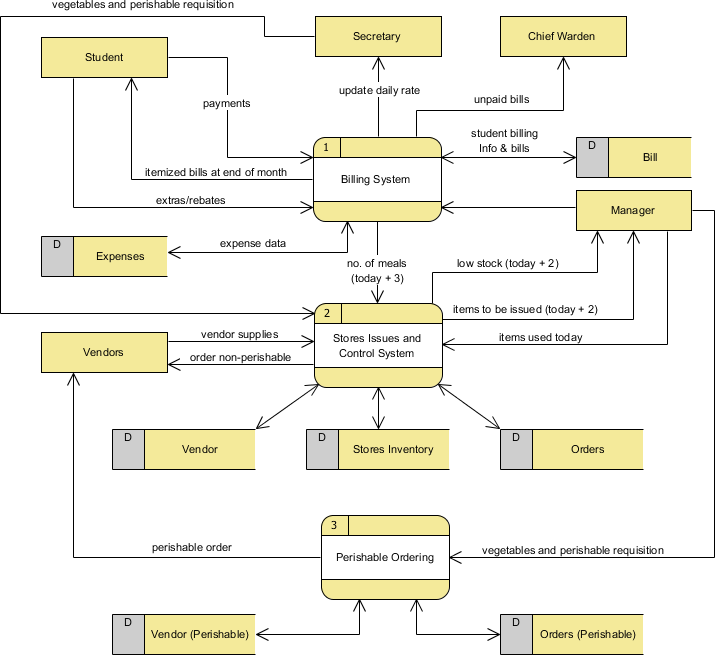
- Level 1 Data Flow Diagram: Breaking down the main process into subprocesses and including data stores, the Level 1 DFD offers a more detailed view. Example:
 Steps for Creating Level 1 DFD:
- Define processes (main process and subprocesses).
- List external entities.
- List data stores.
- List data flows.
- Draw the diagram.
Creating Data Flow Diagrams:
Visual Paradigm is an excellent choice for creating Data Flow Diagrams (DFD) due to its versatility, user-friendly interface, and availability in both online and desktop editions. Here’s why Visual Paradigm stands out as a top recommendation:
Visual Paradigm: A Comprehensive DFD Tool
1. Versatility:
Visual Paradigm supports a wide range of diagram types, making it a comprehensive solution for various visual modeling needs. From DFDs to UML diagrams, it covers a diverse spectrum of diagramming requirements.
2. User-Friendly Interface:
Whether you are a seasoned professional or a beginner, Visual Paradigm provides an intuitive interface that simplifies the process of creating complex diagrams. The drag-and-drop functionality and customizable templates make it easy to craft visually appealing DFDs.
3. Online and Desktop Editions:
Visual Paradigm offers the flexibility of both online and desktop editions, allowing users to choose the platform that best suits their preferences and needs. The online edition enables collaborative work, while the desktop edition provides offline capabilities.
4. Free Version Availability:
While Visual Paradigm offers premium features in its paid versions, it also provides a free version with essential functionalities. This makes it accessible to users with varying budget constraints while still delivering a powerful diagramming experience.
5. Real-Time Collaboration:
The online edition of Visual Paradigm facilitates real-time collaboration, allowing multiple users to work on the same project simultaneously. This is particularly beneficial for teams working on complex systems that require collaborative diagram development.
Visual Paradigm provides extensive documentation and tutorials, making it easier for users to learn and make the most of its features. This support is valuable for both beginners and advanced users seeking to explore the full potential of the tool.
7. Integration Capabilities:
Visual Paradigm integrates seamlessly with other tools and platforms, enhancing its utility in diverse development environments. Whether you are working with version control systems or project management tools, Visual Paradigm can fit into your workflow.
How to Get Started:
- Visit the Visual Paradigm Website: Go to the Visual Paradigm website and choose the edition that suits your needs (online or desktop).
- Download and Install: Download and install the desktop edition or access the online edition through your web browser.
- Create a Free Account: If using the online edition, create a free account to get started. If using the desktop edition, follow the installation instructions.
- Explore Templates and Features: Visual Paradigm offers a variety of templates for DFDs. Explore these templates and start creating your Data Flow Diagram.
Conclusion
In addition to the context and Level 1 DFD, there are deeper levels (Level 2 and Level 3) that provide a more intricate understanding of system dynamics. While DFD creation might demand time, its indispensable value in expressing and communicating crucial information within business processes cannot be overstated. From customer ordering systems to intricate banking processes, DFDs stand as indispensable companions in our data-driven decision-making journey. Understanding the intricate flow of information within a system is pivotal for optimizing processes and making informed decisions, and Data Flow Diagrams serve as the compass in this voyage.
Visual Paradigm emerges as a robust choice for individuals and teams seeking a versatile, user-friendly, and free DFD tool. Its availability in both online and desktop editions ensures flexibility, while its rich feature set and collaborative capabilities make it an invaluable asset for system modeling and diagramming needs.
Leave a Comment
You must be logged in to post a comment.

 Steps for Creating Context DFD:
 Steps for Creating Level 1 DFD: